In the previous article about how to set up InfluxDB, we have imported a sample dataset. Now, we want to show this data in Grafana by fetching it from an InfluxDB data source.
Step 1: Setup the data source connection
Log in to Grafana (usually on http://localhost:3000), and on the left side, click on Configuration and then Data Sources. If you have not done anything yet, you should have no data source up to this point.
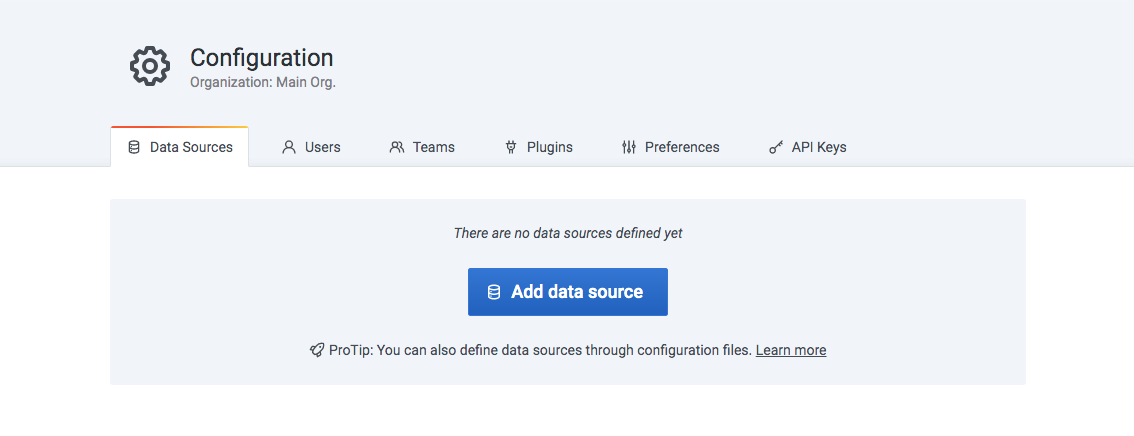
Click on the big blue button saying Add data source. In the search box that appears, type “influx” and click on InfluxDB.
Under HTTP, enter localhost:8086 as the URL. Under Auth, enable Basic auth and give the Basic Auth Details (Username: user, Password: user).
Further down, under “InfluxDB Details”, enter NOAA_water_database as the database name. This is the example database we have set up in a previous tutorial.
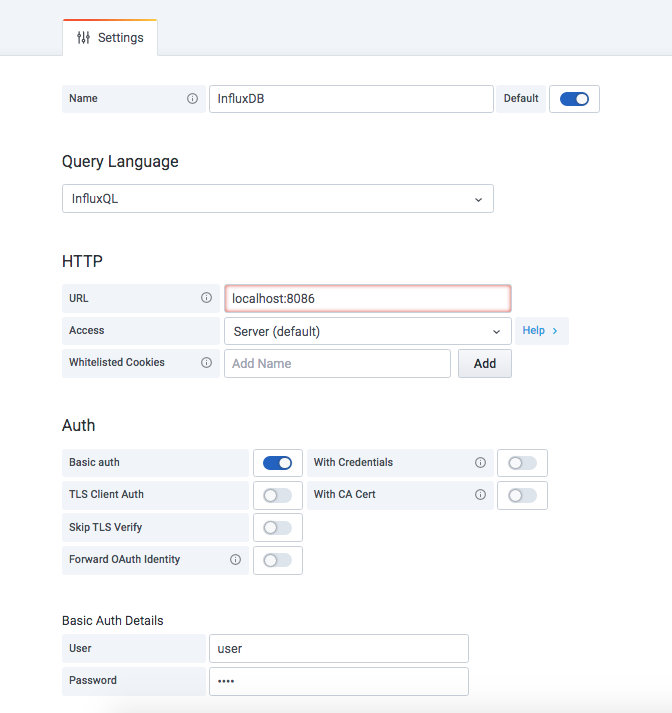
Finally, click “Save & Test” at the bottom.
You should get a green Data source is working feedback:

Step 2: Add a dashboard
Next, we need to add a new dashboard to Grafana. For this, we click on the “+” (plus) icon in the left navigation panel, and select Dashboard.
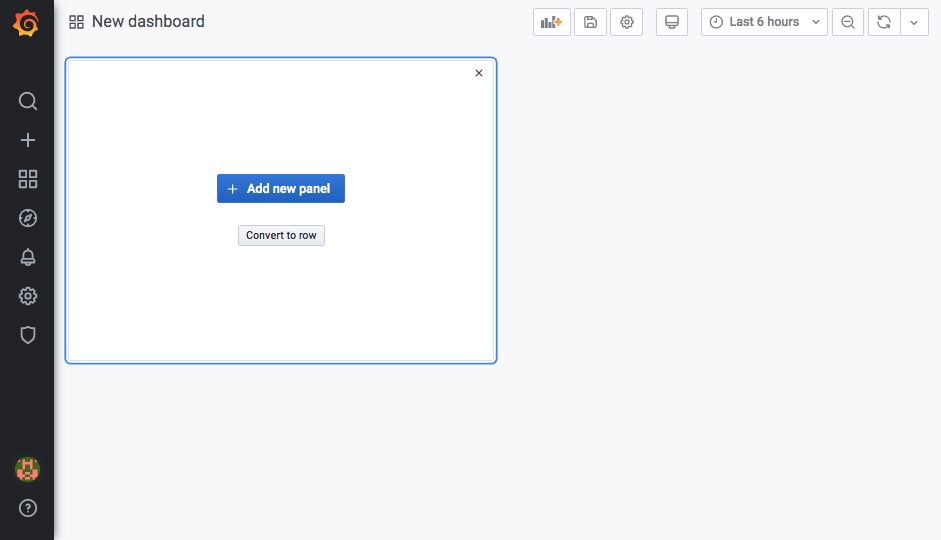
We have no panels in this dashboard yet. Click on the + Add new panel button to add a new panel.
Step 3: Displaying the data from InfluxDB
In the Edit Panel window, select InfluxDB as the data source.
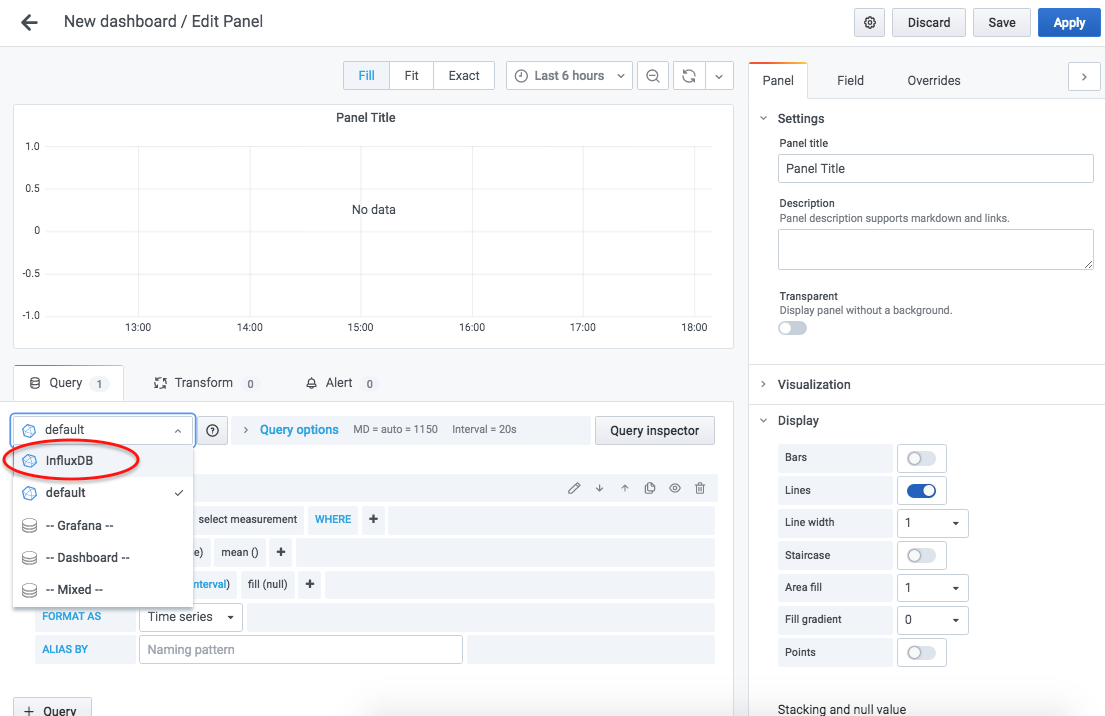
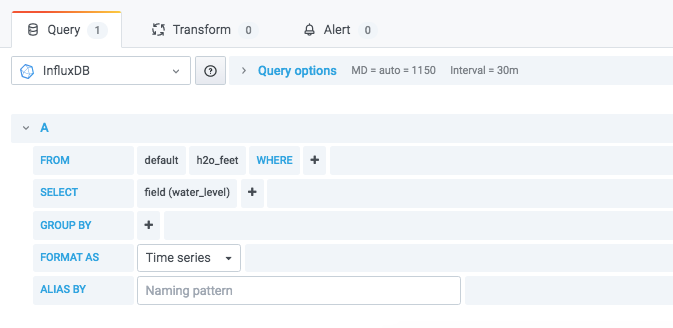
Grafana will now allow you to easily build the query that will be sent to the database. Configure it as shown in the following screenshot. If you have some fields under “Group By” etc., you can easily remove them by clicking on them and then selecting “Remove” in the dropdown menu.
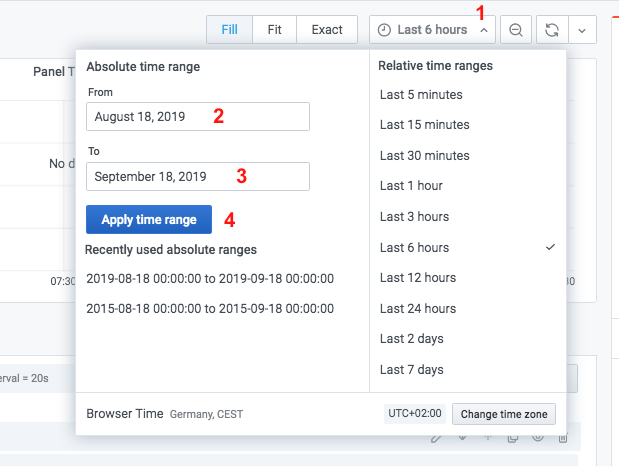
However, the graph still says “No data”. Why is this? The sample data set we use (NOAA water database) only has data from August 18, 2019 until September 18, 2019. Thus, we have to set the correct timespan in the graph in order to get some data displayed. Click on (1), enter the start and end date (2), (3), and click on “Apply time range” (4).
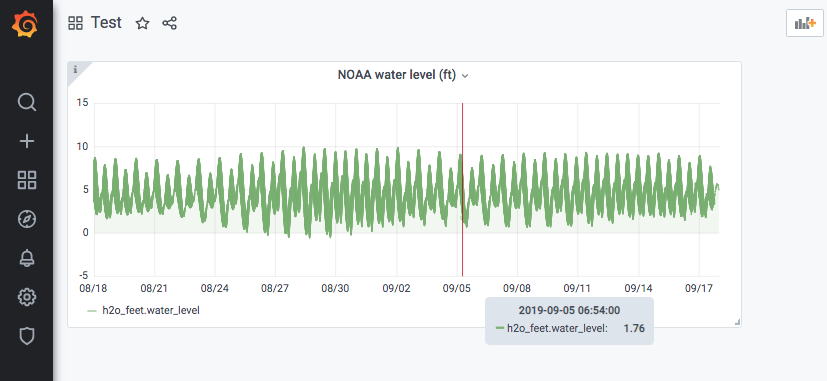
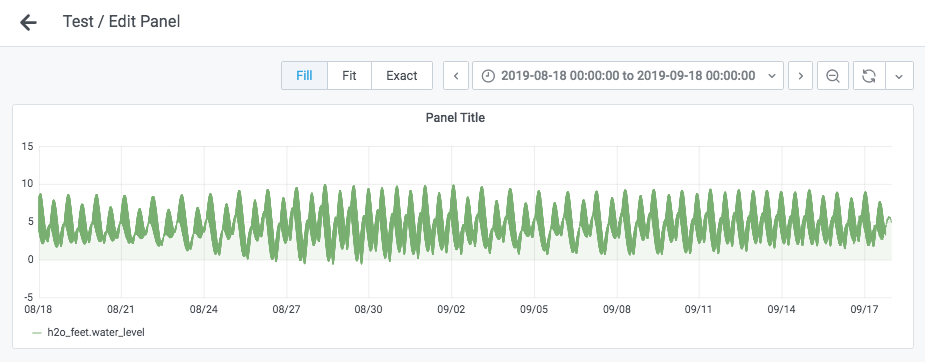
Now you should see the data as follows:
Step 4: Give the panel a title
In order to make the dashboard user understand what data we display, we write this as a title by entering it in the sidebar on the right in the field “Panel Title”. If you want, you can also enter a description.
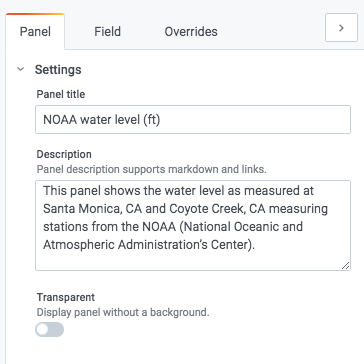
Step 4: Give the panel a title
Save the panel by clicking “Apply” in the top right corner of the page and go back to the dashboard. Here you should now see your new masterpiece 🙂